Where does it all go?
Total operating expenses of patient-focused charities
Expense categories parallel those of revenue as most charities spend most or all of their income in pursuit of their mission. Actual spending on charitable purposes, a specific category that CRA will be looking at, is a measure whose value is debated by sector stakeholders but it is still a focal point of CRA measurement and will be looked at separately. Charities are not required to spend all of their income and can accumulate reserves. Also, due to the nature of calendar year campaigning vs fiscal year spending it sometimes appears that charities spend more than their income and appear to be operating in a deficit situation. It is important to compare a couple of years of data if a more granular look at an individual charity is required.
The patient-focused group of charities spent $1.33 billion or 97.61% of total revenue. By comparison, broad sector expenditures amounted to $261.7 billion or 93.5% of total revenue. Given the variances in reporting periods the difference here is not significant.
Table 12: Number of organizations segmented by operating expense totals
| Category | # of Charities | % of Total | Total Expenditures | % of Total Expenditures |
|---|---|---|---|---|
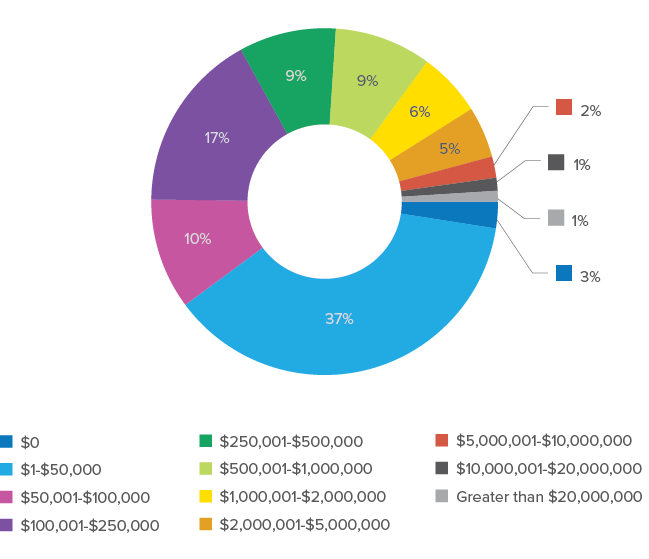
| $0 | 25 | 2.49% | $0.00 | 0.00% |
| $1-$50,000 | 376 | 37.45% | $6,193,961 | 0.46% |
| $50,001-$100,000 | 104 | 10.36% | $7,655,977 | 0.57% |
| $100,001-$250,000 | 169 | 16.83% | $27,576,885 | 2.07% |
| $250,001-$500,000 | 91 | 9.06% | $31,852,663 | 2.39% |
| $500,001-$1,000,000 | 91 | 9.06% | $65,793,947 | 4.93% |
| $1,000,001-$2,000,000 | 60 | 5.98% | $84,885,611 | 6.36% |
| $2,000,001-$5,000,000 | 48 | 4.78% | $137,767,084 | 10.33% |
| $5,000,001-$10,000,000 | 20 | 1.99% | $142,374,260 | 10.67% |
| $10,000,001-$20,000,000 | 12 | 1.20% | $161,331,384 | 12.10% |
| Greater than $20,000,000 | 10 | 1.00% | $668,308,258 | 50.11% |
| Total: | 1004 | 100% | $1,333,740,030 | 100% |
Chart 15: Percentage of organizations segmented by operating expense totals
Total expenditures on charitable activities
The data made publicly available by CRA requires charities to re-categorize some of their expenses in order to provide clarity on spending for the actual charitable purposes of an organization. This might make a charity’s financial statements appear different from these data. This is the proportion of a charity’s total spending that it spends on its end cause, as opposed to other things it might need or choose to spend money on. People sometimes confuse this with the proportion of donations that are spent on the end cause – they’re not the same thing, because many charities, especially larger ones, also have other sources of money than donations. So while there is some debate around the value and interpretation of this metric, it is nevertheless one of the more frequent ones under examination.
Heavy investment from provincial governments in broad sector charities disadvantages the patient groups sector.
When regrouping data from financial statements to accommodate the CRA form, the objective for charities is to have the highest amount reported as charitable activities expenditures. High amounts recorded in fundraising and management and administration will raise flags. While there is limited guidance from CRA on this reporting item, they do advise that charities apply consistent practices from year to year.
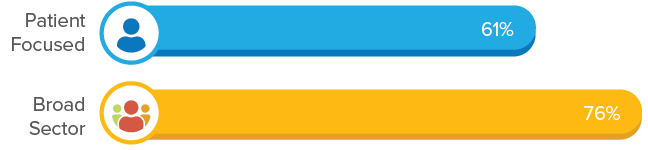
The total sum of $813,466,505 for charitable activities reported by the patient-focused groups represents 61% of total expenditures while the broad sector comes in with 76% of expenditures. Seemingly alarming by comparison, the aforementioned heavy investment from provincial governments in broad sector charities disadvantages the patient groups sector by inflating the charitable activities component of its beneficiaries.
Chart 16: Percentage of expenditures on charitable activities
Total expenditures on management and administration
Of all expenditures by charities, management and administration is one of the most publicized and scrutinized metrics by the public, donors and media. This includes all expenditures related to the overall management and administration of a charity. Other examples of expenditures include:
- holding meetings of the board of directors;
- accounting, auditing, personnel, and other administrative services;
- purchasing supplies and equipment, and paying occupancy costs for offices;
- applying for grants or other types of government funding, and/or for gifts from other charities.
Some expenditures can be considered partly charitable and partly management and administration, such as salaries and occupancy costs. In these cases, there is a transfer of amounts between charitable purposes and management. These expenditures need to be reported on a consistent basis.
Management and administration is one of the most publicized and scrutinized metrics by the public, donors and media.
Complicating the use of this metric is whether a charity has full-time employees or is entirely volunteer driven. It can be seen in our revenue categories that 50% of the patient groups earn less than $100,000. A full-time employee in an organization of this size can skew management numbers significantly. Larger organizations with greater numbers of employees may reallocate certain salary costs to charitable activities thereby reducing administration costs.
This is not a perfect metric by any means. However, guidance comes from a small charity, Charity Intelligence Canada which provides a rating methodology for donors. Their ratings cover cost ratios primarily between 12.5% and 22.5%.
While there are many factors that influence this expenditure, such as size of organization, Charity Intelligence scores a ratio below 12.5% very high, and then ratios are further rated on a scale between 12.5% and 22.5% with no scoring for those over 22.5%. Patient-focused spending in this expense area accounted for 8.16% of expenditures for patient-focused charities and is equivalent to the broad sector which comes in with 8%.
Table 13 lists some selected charities from different revenue categories to illustrate the ranges of management and administration ratio.
Chart 17: Percentage of expenditures on management and administration
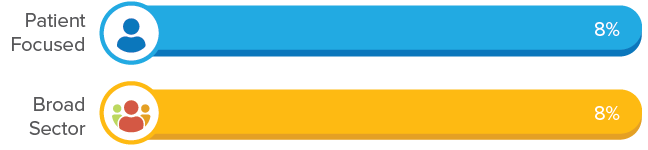
Table 13: Management and Administration Expense ratio for selected groups.
| Organization | Management Expenses | Revenues | Ratio |
|---|---|---|---|
| Canadian Cancer Society | $6,581,000 | $174,777,417 | 3.77% |
| Mitocanada Foundation | $12,193 | $340,283 | 3.58% |
| Alzheimer Society of Canada | $718,966 | $18,939,604 | 3.80% |
| Epilepsy Toronto | $110,582 | $2,123,687 | 5.21% |
| Canadian Cancer Survivor Network | $28,369 | $517,338 | 5.48% |
| Bladder Cancer Canada | $80,239 | $963,109 | 8.33% |
| Crohn’s and Colitis Canada | $1,299,177 | $14,209,274 | 9.14% |
| Canadian Hemophilia Society | $301,545 | $1,780,443 | 16.94% |
| Rare Disease Foundation | $149,778 | $874,158 | 17.13% |
| Juvenile Diabetes Research Foundation Canada | $4,786,098 | $20,775,081 | 23.04% |
| Spina Bifida and Hydrocephalus Association of Canada | $51,349 | $216,354 | 23.73% |
| Canadian Organization for Rare Disorders (CORD) | $211,933 | $749,248 | 28.29% |
| Ottawa Regional Cancer Foundation | $1,303,166 | $4,393,490 | 29.66% |
| The Canadian Society for Mucopolysaccharide & Related Diseases | $55,790 | $145,008 | 38.47% |
| Sickle Cell Association of Ontario | $14,553 | $25,197 | 57.76% |
Total expenditures on education and training for staff and volunteers
The persistent challenge presented by budget constraints often forces organizations to choose between funding programs and training employees. Since training falls under management and administrative spending, the extreme scrutiny that this expense category often claims employee and volunteer training as a victim. There are many good reasons to train staff and volunteers which are dependent upon organizational goals. A charity may need to recruit a strong board, increase fundraising, win more grants, or retain more volunteers to meet its goals.
There is no requirement that charities disclose what training programs they conduct which leaves researchers having to rely on anecdotal evidence. It is thought that a major spending area is in sending staff to conferences and educational symposia. It is harder to isolate any singular activity for volunteers other than any specific training volunteers may need to participate in a particular program. An example of this is the Simulated Patient program conducted by Alzheimer Society which requires specialized training for volunteers.
Just under 30% of patient groups (294) reported total spending on education of $5,626,845 which is less than 0.5 of one percent of total revenue. There is no comparable data for the broad sector. Table 14 lists the top 10 organizations that invested in education along with the percentage of revenue. While many of the expected revenue leaders appear here by simple virtue of revenue size, there is an outlier here identified by the amount spent as a percentage of the charity’s revenue and that is The Charles H. Best Diabetes Centre. They spent $171,213 which is 11.48% of their total revenue while the others spending ranged from 0.16% to 2.85% of their revenue.
As charities enter the post-COVID era, staff and volunteer training in new technologies and methods of program delivery will become a more critical and demanding priority.
Table 14: Top 10 Organizations reporting employee and volunteer education and training.
| Organization | Education Expense | % of Total | % of Charity Revenue |
|---|---|---|---|
| Multiple Sclerosis Society of Canada | $772,642 | 13.73% | 1.62% |
| The Canadian National Institute for the Blind | $328,348 | 5.84% | 0.36% |
| Canadian Cancer Society | $307,029 | 5.46% | 0.16% |
| Muscular Dystrophy Canada | $274,557 | 4.88% | 2.85% |
| Cystic Fibrosis Canada | $183,702 | 3.26% | 0.97% |
| The Charles H. Best Diabetes Centre | $171,213 | 3.04% | 11.48% |
| Heart And Stroke Foundation of Canada | $143,304 | 2.55% | 0.08% |
| Ontario Lung Association | $141,837 | 2.52% | 1.52% |
| Crohn’s and Colitis Canada | $137,332 | 2.44% | 0.93% |
| Juvenile Diabetes Research Foundation Canada | $134,137 | 2.38% | 0.64% |
Total research grants and scholarships
It is hard to contest that medical research is a key priority for many patient-focused charities and forms a foundational plank in their mission. The public is also very attentive to this fact as it is one of the major factors communicated to members as a reason to support the cause.
The public is barraged by online and newspaper ads, billboard and transit advertising, direct mail campaigns, etc. all focusing on the theme of medical research to find a cure. A total of $131,601,788 was reported as research grants and scholarships by 132 or 13.14% of the patient groups. Of course, no comparable data is available for the broader charitable sector as medical research does not extend beyond the health sector.
Most people would agree that research is vital, but when it takes an average of 17 years to develop a new idea into a medical product available to the public, how can medical research charities show the difference they make? The Association of Medical Research Charities (AMRC) in the UK released a report in 2017 that identified 4 key areas of impact:[15]
- Generating new knowledge
- Translating research ideas into new products and services
- Creating evidence that will influence policy or other stakeholders
- Stimulating further research via new funding or partnerships
- Developing the human capacity to do research
As donors look for concrete outcomes from their donations, it can be seen from this chart that patient groups devote from 9% to 78% of total revenue to research.
Table 15 identifies the 12 organizations that spent over $1 million each and whose spending comprises 91% of all of the available research funds. As donors look for concrete outcomes from their donations, it can be seen from this chart that patient groups devote from 9% to 78% of total revenue to research in fulfillment of their mission and their explicit promise to donors. There is one unusual report here; The Multiple Sclerosis Scientific Research Foundation which contributed 271% of revenue to medical research. It appears that there was a disposition of assets that accounts for this anomaly. Otherwise, the highest percentage contribution belongs to Heart and Stroke Foundation Canadian Partnership for Stroke Recovery with over 78% of revenue committed to research.
Table 15: Organizations spending over $1 million on medical research.
| Organization | Research Expense | % of Total Research Funding | % of Organization Revenue |
|---|---|---|---|
| Canadian Cancer Society | $44,099,203 | 33.51% | 23.48% |
| Heart and Stroke Foundation of Canada | $28,753,631 | 21.85% | 16.97% |
| The Multiple Sclerosis Scientific Research Foundation | $12,029,356 | 9.14% | 271.13% |
| Crohn’s and Colitis Canada | $6,285,805 | 4.78% | 42.75% |
| Cystic Fibrosis Canada | $5,371,873 | 4.08% | 28.45% |
| Prostate Cancer Canada | $5,252,796 | 3.99% | 42.26% |
| Multiple Sclerosis Society of Canada | $4,162,686 | 3.16% | 8.73% |
| Heart and Stroke Foundation Canadian Partnership for Stroke Recovery | $4,007,499 | 3.05% | 78.62% |
| The Arthritis Society | $3,983,888 | 3.03% | 15.06% |
| Alzheimer Society of Canada | $3,308,651 | 2.51% | 16.95% |
| Amyotrophic Lateral Sclerosis Society of Canada | $1,525,268 | 1.16% | 19.16% |
| Huntington Society of Canada | $1,022,232 | 0.78% | 23.85% |