Where Does It Come From?
A prominent area of due diligence for many donors is the relationship a charity has with its sources of funding. For donors it helps measure the diversity of income sources, any dependency on single sources and how that leaves the organization vulnerable if key sources withdraw or reduce their funding. For example, with government funding, changing policy environments can affect continued support and payment agreements with governments can impact whether cash flow is available in a timely manner. These inquiries serve to inform of implications regarding sustainability of funding and the subsequent impact on maintaining program continuity.
Total revenue of all charities
There are over 86,000 registered charities in Canada whose total revenue in 2017 amounted to $279 billion.[6] The subsector featured in this report numbers 1004 organizations, fewer than 1.2% of the national total. These groups generated $1.366 billion in revenue, only 0.49% of total charity revenue.
Table 1: Number of organizations segmented by revenue totals
| Category | # of Charities | % of Total | Total Revenue | % of Total Revenue |
|---|---|---|---|---|
| $0 | 36 | 3.59% | NIL | 0 |
| $1-$50,000 | 350 | 34.86% | $6,082,979 | 0.45% |
| $50,001-$100,000 | 116 | 11.55% | $8,413,171 | 0.62% |
| $100,001-$250,000 | 161 | 16% | $26,076,194 | 1.91% |
| $250,001-$500,000 | 100 | 10% | $34,994,275 | 2.56% |
| $500,001-$1,000,000 | 82 | 8% | $59,964,740 | 4.39% |
| $1,000,001-$2,000,000 | 68 | 7% | $94,456,756 | 6.91% |
| $2,000,001-$5,000,000 | 48 | 5% | $140,433,876 | 10.28% |
| $5,000,001-$10,000,000 | 23 | 2% | $164,995,968 | 12.07% |
| $10,000,001-$20,000,000 | 11 | 1% | $157,893,474 | 11.56% |
| Greater than $20,000,000 | 9 | 1% | $673,121,823 | 49.26% |
| Total: | 1004 | 100% | $1,366,433,256 | 100% |
Chart 1: Percentage of Organizations by Revenue Totals
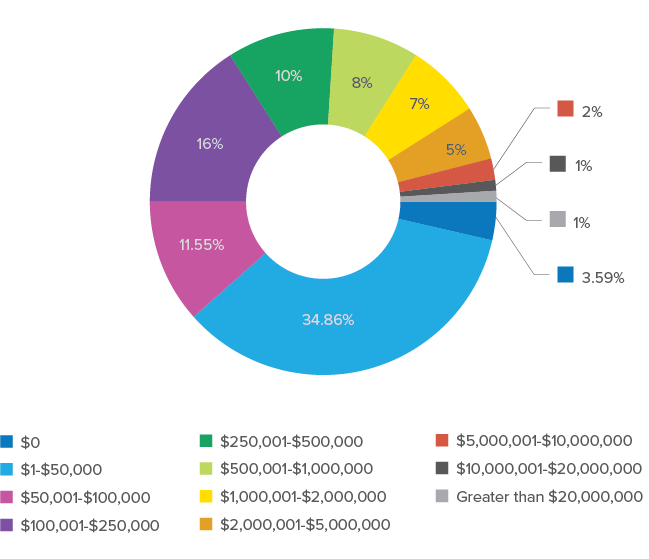
The number of groups earning under $100,000 in revenue during the period evaluated totals 502, exactly 50% of those organizations under review. On the other end of the scale, there were 44 patient organizations with revenue over $5 million or 4.4% of the total.
Table 2 identifies the top 25 organizations by revenue, their percentage of total revenue and the cumulative percentage of total revenue they represent as a group. This table illustrates the degree of domination of a small group of charities when it comes to revenue. For example:
- 62% of all revenue is controlled by only 2% of patient-focused charities.
- 38% of all revenue is shared by the remaining 98% of patient-focused charities.
Patient-focused organizations have been heard to complain about this cross over competition, feeling short changed by the nature of the concrete offer that hospitals can make.
This disparity acutely underscores the degree of competition for funding among these groups. With diminishing numbers of individual donors,[7] there are a finite number of other sources – events, grants, sponsorships, etc. – available to this specific sector. Many of those sources also attract charities from outside the patient-focused sector which serves to inflame the competition. It also illustrates the intersectional nature of competition for funding sources. For instance, while this report has excluded hospital foundations, these organizations nevertheless serve as powerful competitors for funding. Patient-focused organizations have been heard to complain about this cross over competition, feeling short changed by the nature of the concrete offer that hospitals can make (e.g. tangibles such as MRI, CT, lab) versus the more abstract offer of investing in the remote hope for a cure – a fundamental pitch many disease charities use.
Table 2: Top 25 organizations by revenue
| Charity | Revenue | % Total Revenue | Aggregate Total % |
|---|---|---|---|
| Canadian Cancer Society | $187,804,352 | 12.71% | 13% |
| Heart And Stroke Foundation Of Canada | $169,462,000 | 11.47% | 24% |
| Canadian National Institute For The Blind | $92,399,362 | 6.25% | 37% |
| British Columbia Transplant Society Branch | $64,136,393 | 4.34% | 42% |
| Multiple Sclerosis Society Of Canada | $47,688,360 | 3.23% | 45% |
| Canadian Diabetes Association | $36,351,844 | 2.46% | 47% |
| The Kidney Foundation Of Canada | $27,996,642 | 1.89% | 49% |
| The Arthritis Society | $26,459,140 | 1.79% | 51% |
| Juvenile Diabetes Research Foundation Canada | $20,823,730 | 1.41% | 52% |
| Alzheimer Society Of Canada | $19,522,888 | 1.32% | 54% |
| Cystic Fibrosis Canada | $18,881,000 | 1.28% | 55% |
| Movember Canada | $18,189,734 | 1.23% | 56% |
| Canadian Deafblind Association Ontario Chapter | $15,036,388 | 1.02% | 57% |
| Head Injury Rehabilitation Ontario | $14,994,149 | 1.01% | 58% |
| Crohn’s And Colitis Canada | $14,704,213 | 1.00% | 59% |
| The Leukemia & Lymphoma Society Of Canada | $12,837,620 | 0.87% | 60% |
| Prostate Cancer Canada | $12,428,912 | 0.84% | 61% |
| Praxis Spinal Cord Institute | $10,604,738 | 0.72% | 62% |
| Parkinson Canada Inc. | $10,400,951 | 0.70% | 62% |
| Spinal Cord Injury Ontario | $10,292,881 | 0.70% | 63% |
| Pediatric Oncology Group Of Ontario | $9,856,938 | 0.67% | 64% |
| Alzheimer Society Of B.C. | $9,728,822 | 0.66% | 64% |
| Autism Society Ontario | $9,718,412 | 0.66% | 65% |
| Muscular Dystrophy Canada | $9,649,909 | 0.65% | 66% |
Amounts charities issued tax receipts
The ability to issue official donation receipts is the most important benefit to Canadian registered charities. Donations of cash, goods, land, or listed securities to a registered charity are eligible for a charitable tax credit which the taxpayer reports on his or her tax return. This tax benefit to donors incentivizes benevolence. Arguably, Canadian tax laws for charitable giving are among the most generous among developed nations. Tax receipted revenue is directly related to the relationship the organization has with its core supporters and individual donors.
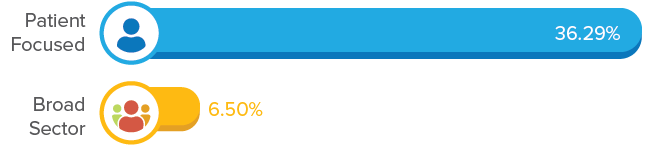
The charities in our sector issued tax receipts for $495,858,177 or 36.29% of total revenue. This contrasts starkly with the national percentage of 6.5% (2017) which would indicate a much higher dependency on this revenue source for the sustainability of the charities than the entire sector average.
Chart 2: Percentage of revenue issued as tax receipts
Amounts received from other registered charities
There are three types of registered charities. Every registered charity is designated as one of the following:
- charitable organization
- public foundation
- private foundation
…foundations are allowed to accumulate assets, which total in excess of $80 billion for the full sector, they are restrained by regulation to a disbursement quota of 3.5% of assets.
Inter-charity transfers represent amounts that are primarily coming from private or public foundations. For example, a hospital foundation may contribute funds to the hospital it supports, with both organizations being registered charities. Or a private foundation may contribute to a research project. This implies a co-dependency between organizations and the necessity for alignment to shared purpose.
While charitable foundations are allowed to accumulate assets, which total in excess of $80 billion[8] for the full sector, they are restrained by regulation to a disbursement quota of 3.5% of assets in any giving year. While this preserves the ability of foundations to be continuous sources of revenue, it also places strict boundaries on the amount of funding available. It goes without saying that foundation support comes with great due diligence by the foundation, making competition fierce and limiting the number of qualifying organizations. Sector leaders have advocated to increase the disbursement quota but no legislative change has as yet been enacted.
There are other types of transfers, including from a head or national office to a local affiliate, or vice versa. Some organizations raise funds to contribute to research or projects managed by other charities.
Inter-charity revenue for patient-focused groups plays a much more important and growing role in funding programs than it does in the broad sector.
Inter-charity revenue for patient-focused health charities was $87,038,101 or 6.37% of total revenue. With 45% of organizations reporting this revenue source, it demonstrates a high degree of interaction between organizations of shared purpose.
Consistent with other revenue disparities, this source is primarily dominated by a top tier of organizations with 23 organizations earning a minimum of $1 million each from this source which is over 67% of the total received by all groups, leaving 95% of the remaining organizations competing for less than 33% of the revenue.
The broad sector reported inter-charity revenue in 2017 of $7.262 billion or 2.6% of total revenue indicating that inter-charity revenue for patient-focused groups plays a much more important and growing role in funding programs than it does in the broad sector.
Chart 3: Percentage of revenue received from other charities
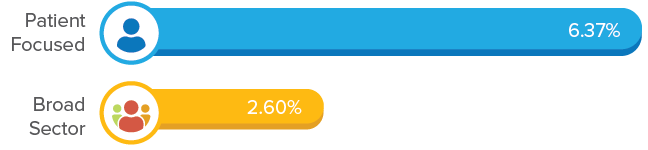
Table 3: Organizations reporting over $1 million of Inter-Charity revenue
| Organization | Inter-Charity Revenue | % of Total Revenue | Aggregate Total % |
|---|---|---|---|
| Praxis Spinal Cord Institute | $7,516,053 | 8.64% | 8.64% |
| Alzheimer Society of Canada | $7,384,210 | 8.48% | 17.12% |
| Canadian Cancer Society | $4,653,232 | 5.35% | 22.47% |
| Prostate Cancer Canada | $4,648,913 | 5.34% | 27.81% |
| The Multiple Sclerosis Scientific Research Foundation | $4,213,046 | 4.84% | 32.65% |
| Heart and Stroke Foundation of Canada | $3,518,160 | 4.04% | 36.69% |
| Juvenile Diabetes Research Foundation Canada | $2,787,151 | 3.20% | 39.89% |
| Canadian Diabetes Association | $2,147,578 | 2.47% | 42.36% |
| Heart and Stroke Foundation Canadian Partnership for Stroke Recovery | $2,139,790 | 2.46% | 44.82% |
| Multiple Sclerosis Society of Canada | $2,095,607 | 2.41% | 47.22% |
| The Canadian National Institute for the Blind | $1,883,894 | 2.16% | 49.39% |
| Heart and Stroke Foundation of Ontario | $1,731,000 | 1.99% | 51.38% |
| Ontario Society for Crippled Children | $1,728,838 | 1.99% | 53.36% |
| Canadian Lung Association | $1,475,806 | 1.70% | 55.06% |
| Amyotrophic Lateral Sclerosis Society of Canada | $1,410,897 | 1.62% | 56.68% |
| Alzheimer Society of B.C. | $1,356,145 | 1.56% | 58.24% |
| Starlight Children’s Foundation Canada | $1,279,754 | 1.47% | 59.71% |
| Alzheimer Society of Toronto | $1,179,226 | 1.35% | 61.06% |
| Pediatric Oncology Group of Ontario | $1,107,250 | 1.27% | 62.34% |
| Alzheimer Society of Alberta and Northwest Territories | $1,091,835 | 1.25% | 63.59% |
| Canucks Autism Network Society | $1,070,635 | 1.23% | 64.82% |
| Crohn’s and Colitis Canada | $1,019,776 | 1.17% | 65.99% |
| Trillium Childhood Cancer Support Centre | $1,012,815 | 1.16% | 67.16% |
Other gifts received for which a tax receipt was not issued
When is a gift not eligible for a tax receipt?[9] The simplest type of example would be anonymous donations collected by a coin box on a retail counter. Interestingly the Income Tax Act does not define “sponsorship”. CRA takes the view that generally receipts cannot be issued for sponsorship fees because the sponsor receives something in exchange and the fees are usually paid to support a charity event in return for some type of consideration. Contributions can also come from a company’s social responsibility (CSR) program. A business may deduct 100% of a sponsorship fee or CSR costs as a business expense so tax receipting the gift amounts would amount to compounding the tax benefit, something CRA frowns on.
Other types of gifts not eligible for receipts include[10] donations of services, gift cards and certificates, donations directed to specific individuals or families. Due to the unclear nature of these gifts, it is difficult to trace their origins to specific sources, hence they are lumped under the “Other” category and charities are left to allocate these revenues according to their usual practices.
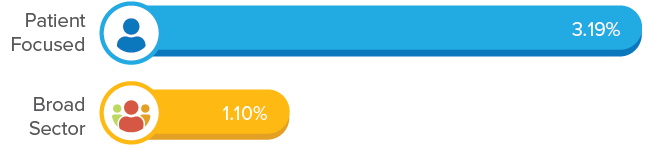
In our group, 531 (53%) organizations earned $43,616,337 or 3.19% of revenue from non-tax receipted gifts. This compares to 1.1%, or $3.016 billion of total sector revenue implying a greater dependency on such gifts than the broad sector. Only 22 organizations reported non tax-receipted revenue of $500,000 or more with Multiple Sclerosis Society the top earner with $5,817,858.
Chart 4: Percentage of revenue for which a tax receipt was not issued
Government funding overview
Funding of the broad 86,000 charity sector from all levels of government, was in excess of $183 billion in 2017, almost 66% of all funding. Total government funding for patient-focused charities was $337,918,293 or 24.73% of revenue, which on the surface, appears to be a significant reduction from the broad sector. Government related charities include organizations such as hospitals, universities and colleges. Health and education account for the largest portion of the broad sector’s economic activity. The size and scope of these institutions account for the large investments by government. The numbers speak for themselves in 2017 with government transfers to the entire health charity sector amounting to $98.75 billion, almost 54% of government funding available to all charities.
When breaking down the total of government funding to the respective levels, it is quickly evident which level is the primary source. For health funding, provincial governments provide the bulk of revenue, 90% nationally across the sector and 92% among patient-focused organizations.
Government funding represents a substantial portion of the income for charities in the form of grants and reimbursement for delivering services. The role of the federal and municipal governments is statistically small compared to the provincial government. It would not be a stretch to consider the charities that are delivering services on behalf of provincial governments to have entered into a social contract in order to support the social fabric of society. They are however, for all intents and purposes, agents of the government and while structured as charities, must still conduct themselves under the rules and control of the governing regime.
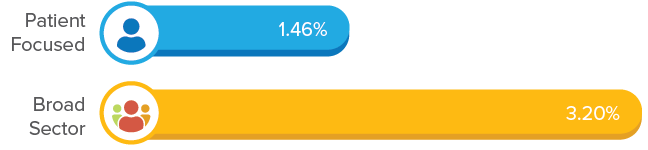
Revenue received from federal government.
With only 1.46% ($19,984,713) of total revenue coming from the federal government, it is a challenge for many of the patient-focused groups to devote resources to chasing this money. That only 17% of groups received any funding from the federal government underscores the challenge. From the top 10 list in Table 4 it can be seen that some of the largest groups are getting the majority of the money, with those on this list getting more than 60% of total federal funding.
The broad sector receives 3.2% of their funding from the federal government, over twice that of the patient-focused charities.
Chart 5: Percentage of revenue from Federal Government
The federal government is important because it controls the purse strings for a lot of research – a key purpose of many of these groups. It also creates national health policy and thus charities that have programs or a purpose that is aligned with critical government policy initiatives can sometimes slip stream behind the policy and receive valuable grants. It does require investment in political activities and given the nature of election cycles and unforeseen economic impacts, it is not always money that can be relied on annually.
Table 4: Top 10 Organizations by Federal Government Revenue received and their percentage of the total.
| Organization | Amount | % of Total | Aggregate Total % |
|---|---|---|---|
| The Canadian National Institute for the Blind | $3,136,912 | 15.70% | 15.70% |
| Canadian Cancer Society | $2,923,262 | 14.63% | 30.32% |
| Childhood Obesity Foundation (COF) | $1,228,619 | 6.15% | 36.47% |
| Heart And Stroke Foundation of Canada | $1,163,680 | 5.82% | 42.29% |
| Community-Based Research Centre Society | $862,086 | 4.31% | 46.61% |
| Spinal Cord Injury Canada | $684,313 | 3.42% | 50.03% |
| Alzheimer Society Of Sarnia-Lambton | $593,147 | 2.97% | 53.00% |
| The Canadian Association of the Deaf | $507,755 | 2.54% | 55.54% |
| South Asian Autism Awareness Centre | $465,144 | 2.33% | 57.87% |
| Canadian AIDS Society | $455,149 | 2.28% | 60.15% |
Revenue received from provincial/territorial governments
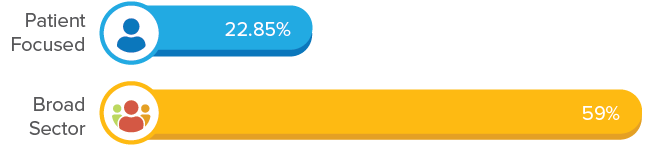
Funding from provincial governments for patient-focused charities amounted to $312,261,598 or 22.85% total revenue. The numbers for provincial funding are skewed somewhat due to the overwhelming amount by one organization, the British Columbia Transplant Society Branch with $63,878,737, more than 20% of the total. It does indicate, however, the support provincial governments will give to critical health needs when there is a clear policy directive. It is also illustrative of the agency relationship that many of these charities have with their provincial masters.
The broad sector receives 59% of their funding from the provincial government, 2.5 times that of the patient-focused charities.
Chart 6: Percentage of revenue from Provincial Government
This serves to highlight the critical social service role that these charities play in the delivery of health services to citizens. Our current sample includes 299 groups with over 50 organizations receiving $1,000,000 or more. It may not be immediately obvious that these groups are involved in social and community support of patients given the greater perception of them as advocacy organizations, many are active participants in supporting patients through a variety of programs that deliver social and care support such as social workers, respite for caregivers, etc. Conversely, those organizations who are not counted among this group as they are not patient-focused in their purpose, but are receiving the bulk of provincial funding of health, have intersecting interests with patient-focused organizations. These intersections and the alignment of shared purpose between organizations will be the subject of further investigation in our next report on social service agencies.
Table 5: Top 10 Organizations by Provincial Government Revenue received and their percentage of the total.
| Organization | Amount | % of Total | Aggregate Total % |
|---|---|---|---|
| British Columbia Transplant Society Branch | $63,878,737 | 20.46% | 20.46% |
| The Canadian National Institute for the Blind | $32,792,655 | 10.50% | 30.96% |
| Deafblind And Sensory Support Network of Canada | $13,079,411 | 4.19% | 35.15% |
| Head Injury Rehabilitation Ontario | $12,513,875 | 4.01% | 39.15% |
| Canadian Cancer Society | $10,380,365 | 3.32% | 42.48% |
| Spinal Cord Injury Ontario | $8,256,222 | 2.64% | 45.12% |
| Cerebral Palsy Parent Council of Toronto | $8,089,502 | 2.59% | 47.71% |
| Pediatric Oncology Group of Ontario | $7,408,565 | 2.37% | 50.09% |
| Autism Society Ontario | $6,614,355 | 2.12% | 52.20% |
| Brain Injury Community Reentry (Niagara) Inc | $5,923,874 | 1.90% | 54.10% |
Revenue received from municipal / regional governments
The municipal level of government supports charities focused on their local communities. However, with such a small sum available nationwide, only $5.67 million, it takes just 10 organizations to corral over 65% of the funding. It is interesting to note that none of the large charities that have dominated other funding sources even appear on this top 10 list. From this list we can see that the local emphasis is on social support, ranging from supportive housing to relieving the burden on caregivers. Relationships with public health officials are critical as many municipal programs are conducted in partnership with, or funded by, public health, which are a local responsibility.
The broad sector receives 3.3% of their funding from municipal governments, almost 8 times that of the patient-focused charities.
Chart 7: Percentage of revenue from Municipal Government
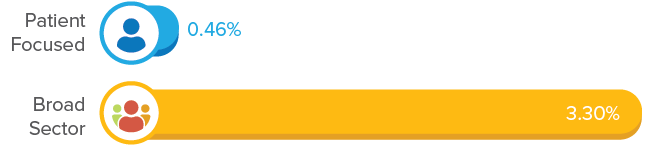
Table 6: Top 10 Organizations by Municipal Government Revenue received and their percentage of the total.
| Organization | Amount | % of Total | Aggregate Total % |
|---|---|---|---|
| Sidalys | $1,122,342 | 19.79% | 19.79% |
| Regional HIV/AIDS Connection | $680,312 | 11.99% | 31.78% |
| AIDS Committee of Toronto | $533,089 | 9.40% | 41.18% |
| AIDS Committee of Windsor | $259,798 | 4.58% | 45.76% |
| Société Alzheimer Rive-Sud | $233,453 | 4.12% | 49.88% |
| Société Alzheimer Outaouais / Alzheimer Society Outaouais | $221,900 | 3.91% | 53.79% |
| Epilepsy South Central Ontario | $180,445 | 3.18% | 56.97% |
| Alberta Caregivers Association | $172,676 | 3.04% | 60.01% |
| Africans In Partnership Against AIDS | $172,520 | 3.04% | 63.06% |
| Autisme De l’Est-Du-Québec | $144,104 | 2.54% | 65.60% |
Tax-receipted revenue for all sources outside of Canada
Charities in Canada may receive gifts from non-resident individuals and nonresident charities. As a general rule, such individuals and organizations would not be entitled to deduct such contributions for Canadian income tax purposes and therefore would not require an official income tax receipt from the Canadian charity.
Canada can be seen as an attractive charitable investment destination. The low value of the currency implies a lower cost of delivering on the mission of the organization. Foreign sources of revenue may be from governments, foundations, individuals or corporations.
Charities are responsible for making sure that they do not operate in association with individuals or groups that are engaged in terrorist activities, or that support terrorist activities.
As with all individuals and organizations in Canada, charities are responsible for making sure that they do not operate in association with individuals or groups that are engaged in terrorist activities, or that support terrorist activities. CRA publishes a checklist for charities to prevent abuse of charities to fund terrorist organizations or charities being used for money laundering purposes.
It is a singular priority for a highly regulated industry to perform proper due diligence to know where support for charity partners comes from to be insulated against any connection to illegal activity, whether known or unknown to the charity partner.
Only 34 of our groups or 3% of the total reported tax-receipted foreign revenues, with the top 10 groups reaping over 92% of this revenue source. The Canadian Cancer Society is the top earner with $318,867, or 26% of the total but not a significant sum in comparison to the Society’s revenue of $187 million.
Non tax-receipted revenue for all sources outside of Canada
As stated above, most foreign contributors would likely be ineligible for Canadian tax credits subverting the need for a tax receipt. There may be some international jurisdictions that have an exemption for certain countries, possibly including Canada, but it is by no means broadly applied and foreign contributors must abide by their local tax laws. It would be assumed that savvy international donors have processes in place to accommodate local circumstances.
In a world where disease knows no borders this data raises some interesting question about the international relationships of national patient-focused organizations.
Our 5 top groups consume over 75% of all non tax-receipted revenue from outside of Canada with Crohn’s and Colitis Canada the top earner with $1,730,923.00, almost 30% of the total of this category.
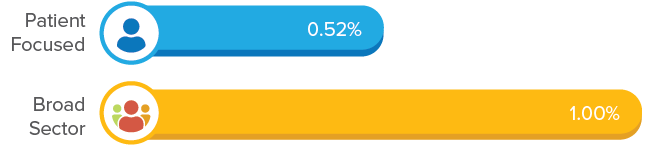
Due to the way data has been made available, we have combined both receipted and non-receipted gifts to provide an accurate comparison to the broad sector. Patient-focused charity total income from these two sources is $7,057,295, only 0.52% of revenue. This compares with the broad sector total of all gifts from outside Canada, both receipted and non-receipted, of $2.32 billion or less than 1% of sector revenue. Patient-focused groups appear marginally less dependent on foreign sources of revenue than the broad sector which we take to mean that the missions of patient-focused groups have an explicit pan-Canadian focus. It may be a reality experienced on a global basis by national and local patient organizations with very little in the way of international inter-dependency. In a world where disease knows no borders this data raises some interesting question about the international relationships of national patient-focused organizations.
Chart 8: Percentage of revenue from outside Canada
It should also be noted that in compiling our database we explicitly excluded health charities with a focus on programs delivered outside
of Canada.
Interest and investment income received or earned
While charities can have large reserves, the public may question the need to continue fundraising as opposed to drawing on the reserves.
The entire issue of financial constraints imposed on charities by the regulatory regime can be confusing at the best of times. For instance, charities are permitted to have reserves – in fact having unrestricted funds can be vital to manage fluctuations in income, different expenditure requirements and times of crisis such as the current pandemic. However, the public does not understand the difference between assets, endowments, perpetual endowments, reserves, cash, etc. They see funds listed as assets and many assume that these are freely available for expenditure by the charity. And while charities can have large reserves, the public may question the need to continue fundraising as opposed to drawing on the reserves.
The CRA has provided guidance on the matter, which in itself, contributes to the confusion:[11]
- 64. Canadian law requires that a registered charity be established and operated for charitable purposes and devote its resources to charitable activities. While the CRA recognizes that charities can, and often should, maintain reserves, fundraising that results in an unjustified level of reserves may indicate that the charity is failing to meet this requirement.
Apparently, then, there is the need to walk a fine line for those holding reserves or maintaining assets. Added to that is the scrutiny given to the investment of those assets. Assets are an indicator of financial strength and stability and the numbers demonstrate a wide range of possible outcomes that organizations may experience with their investments.
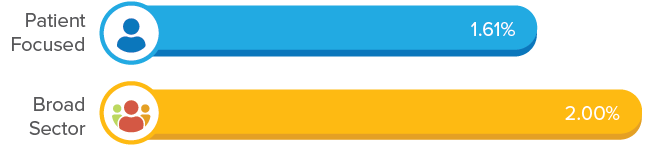
Over 42% (423) of our groups reported investment income that amounts to $22,028,971 or 1.61% of total revenue. The top 10 organizations control over 71% of this revenue with the Heart and Stroke Foundation a clear leader with $6,229,257 (28%) and Canadian Cancer Society a distant second with $3,592,197 (16%). Like any investor, however, charities are subject to the whims of the market and the strength of their investment strategies. There are 13 groups that reported a loss with Canadian Diabetes Association declaring a loss of $114,724 and Parkinson Canada reporting $49,146 in losses.
The broad charitable sector reported $5.379 billion in interest approximately 2% of total income. Compared to this data, the patient-focused 1.50% of total revenue is marginally weaker and provokes some questions relating to organizational sustainability for some.
Chart 9: Percentage of revenue from interest and investment income
Non tax-receipted revenues received for memberships, dues and association fees
In 2017, the broad sector reported $1.739 billion of revenue generated from memberships and dues, just 0.62% of total revenue. There is limited data available on membership fees but the trend over the last 13 years has witnessed a continued erosion in membership revenue from a potential high of 16% in 2007[12] to the current level of 0.62%.
Chart 10: Percentage of revenue from membership dues
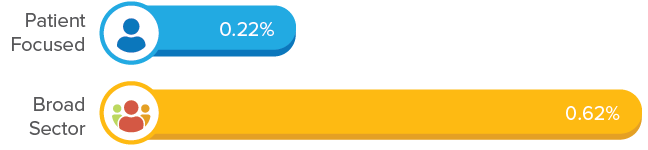
For patient-focused charities, the numbers are even more dismal. While 235 (24%) groups reported, the total revenue of $3,030,252 only amounts to .22% of total revenue, arguably, a miniscule sum. Almost 69% of this revenue is accounted for by 15 charities with SHBC: Speech and Hearing BC Association topping the list with $263,088 (8.7%). Contrary to expectations, the largest charities – Canadian Cancer Society, Heart and Stroke Foundation – do not appear on the list at all.
With donor trends changing over the last decade, donor relationships to causes are also changing and are less entrenched in brand loyalty. This leads to questions related to the ability of charities to recruit and maintain volunteers for program delivery and continuity of donor participation in programs such as annually recurring fundraising events.
Non tax-receipted revenue from fundraising
The last time you attended a gala dinner and paid $250 for the ticket, it is likely that you did not receive a tax receipt for the full amount of $250. When a donation comes with a benefit to the contributor, the benefit is considered an “advantage” by CRA and must be deducted from the total to be tax receipted. In the case of the gala dinner, the advantages may be calculated at $100 worth of food and entertainment leaving you with a tax receipt of only $150. The balance is still accounted for by the charity as non tax-receipted revenue.
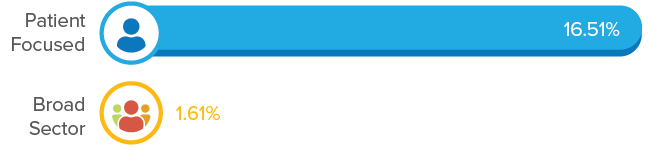
Non tax-receipted revenue from fundraising was reported by 564 (56%) patient-focused groups for a total of $225,618,043 or 16.51% of total revenue. Leaders are once again Canadian Cancer Society with $59,566,390 (26.40%), Heart and Stroke Foundation Of Canada $34,000,190 (15.07%) and Canadian Diabetes Association $11,306,203 (5.01%).
The broad sector reported $3.052 billion or 1.1% of total revenues which seems to imply that the patient-focused sector has a much greater dependency on this revenue source than the broad sector. Events may seem to play an important role here for these charities as this type of revenue is often associated with them.
Chart 11: Percentage of non tax-receipted revenue from fundraising
Revenue from sale of goods and services
The term “earned income” is generally applied to activities that involve selling goods or services to customers. It is estimated that up to 75% of all charities have engaged in these activities. The range of goods and services is extremely broad, and includes products, expertise, processes, and intellectual property (Imagine Canada, 2013). Customers can be individuals, groups, businesses, or other charities.
It has become an important source of revenue and can be used to financially support the organization or a specific program. Not all earned income activities record a profit and the level of participation in earned income activities varies significantly according to the characteristics of a charity. Their amount of annual revenues and whether they employ full-time staff are key determinants that shape an organization’s approach. For some organizations it can represent more than one-third of total revenue.
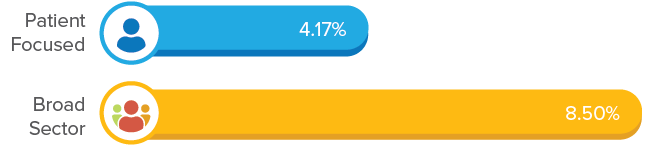
The broad sector generated $23.127 billion from the sale of goods and services which represents 8.5% of all revenue. The patient-focused sector, on the other hand, has reported $56,995,775 or 4.17% of revenue. As this is less than 50% of the percentage achieved by the broad sector it indicates this revenue source could be an area due for improvement.
Chart 12: Percentage of revenue from sale of goods and services
As seen in some of the earlier analyses, the concentration of revenue is dominated by a small number groups. The Canadian National Institute for the Blind is the clear leader with $18,764,986, almost one-third of all earned revenue. Canadian Diabetes Association is a distant second with $4,054,849.
Whether engaging earned income by operating a social enterprise or as part of their range of activities, charities have demonstrated that there is capacity to manage these enterprises which can be significant contributors to the financial sustainability of an organization.
There are some unexpected organizations in Table 7 which account for over 71% of all earned income. Cerebral Palsy Association in Alberta reported $1,965,186 which is 64% of their total revenue. Meanwhile Diabete Drummond Inc. reports $1,518,541 which constitutes almost 98% of their revenue. Whether engaging earned income by operating a social enterprise or as part of their range of activities, charities have demonstrated that there is capacity to manage these enterprises which can be significant contributors to the financial sustainability of an organization. There is much room for performance improvement in this revenue source for patient-focused charities and much to be learned and shared from those who are doing it successfully.
Table 7: Top 10 earners of revenue from the sale of goods and services.
| Organization | Amount | % of Total Earned Income | Aggregate Total % |
|---|---|---|---|
| The Canadian National Institute for the Blind | $18,764,986 | 32.92% | 32.92% |
| Canadian Diabetes Association | $4,054,849 | 7.11% | 40.04% |
| Western Institute for the Deaf and Hard of Hearing | $3,881,291 | 6.81% | 46.85% |
| Heart and Stroke Foundation of Canada | $3,100,110 | 5.44% | 52.29% |
| Canadian Cancer Society | $3,004,070 | 5.27% | 57.56% |
| Cerebral Palsy Association in Alberta | $1,965,186 | 3.45% | 61.01% |
| Head Injury Rehabilitation Ontario | $1,781,689 | 3.13% | 64.13% |
| Diabete Drummond Inc. | $1,518,541 | 2.66% | 66.80% |
| Integrated Services for Autism and Neurodevelopmental Disorders | $1,468,648 | 2.58% | 69.37% |
| Deafblind and Sensory Support Network of Canada | $1,251,558 | 2.20% | 71.57% |
Other revenue
“Other” revenue accounts for all other sources of revenue that do not fall into any of the above categories. These sources can range from conference fees to bequests to amortization of deferred capital. While many appear related to events, there are also some that are purely administrative in nature. Organizations are required to described these “other” activities and from the selection provided in Table 8 of the most popular reported sources, it becomes clear that it constitutes quite a variety.
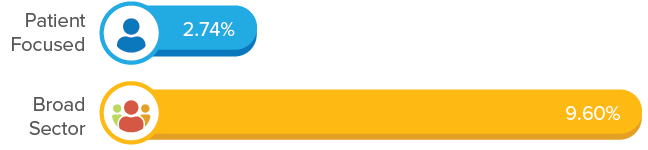
Patient-focused groups reported $41,755,208 or 2.74% of total revenue. This compares with the broad sector reporting $26.92 billion, 9.6% of total revenue.
Chart 13: Percentage of revenue from Other revenue
Surprisingly, there are some unexpected organizations reporting significant “Other” revenue that aren’t normally on any of the top 10 lists. Hypertension Canada reported $1,020,382 which is 73% of their total revenue. The description for these funds was “sponsorships / grants”. The Save Your Skin Foundation reported $1,267,475 which is 95% of their revenue. And Obesity Canada reported $997,517, over 97% of their total revenue.
Whatever the source, it appears that patient-focused organizations still have room to grow in this revenue category and perhaps learn from some of these unexpected leading and perhaps innovative organizations.
Table 8: Types of Other revenue
| Administration | Misc. Fundraising | Events |
|---|---|---|
| Amortization of Deferred Capital | Bequests | Walk, swim, bike, marathon |
| Gain on sale of capital asset | Community grants – United Way | AGM registration fees |
| GST/HST recovery | Summer job grants | Conference registration fees |
| Recycling fees | Research grants | Conference sponsorship fees |
| Other grants | Bingo | |
| Camp fees | ||
| Golf tournament | ||
| Other sponsorships | ||
| Advertising | ||
| Speaking honorarium |