What are they getting paid?
Total number of permanent compensated positions
The subject of employees and compensation is often top of mind for the public and many donors. This perspective is often shaped by our concept of volunteerism. Despite the fact that the charitable sector delivers important social services and vital support to vulnerable people, many people believe it should be a purely voluntary activity. This is particularly true in health care. Our contemporary model of care is based on a medieval delivery of care by faith based organizations that was conducted as an act of charity.
It is sometimes perceived that major charities have bloated bureaucracies, excessive salaries, and pampered executives.
In addition, donors are looking for concrete outcomes for their investments in charitable activities and view any costs incurred beyond the hard costs of program delivery as suspect. It is sometimes perceived that major charities have bloated bureaucracies, excessive salaries, and pampered executives.
Adding fuel to the fire is the lack of in-depth human resource data for this sector. Unlike other sectors like mining, construction, or agriculture there is no comprehensive national labour market data for the charitable sector. So donors and sponsors do not have enough information to understand the labour needs of their beneficiaries, and the sector has no way of planning a human resources strategy in order to identify and fulfill sector needs. The Human Resources Council for the Voluntary & Non-profit Sector was created in 2005 with a mandate to bring employers and employees together to provide leadership, build knowledge, and develop strategies on issues related to employment and by extension to provide the data necessary to inform these decisions. It was shut down in 2013 when it lost its funding.
There is hope for change. Recommendation 7 of the Senate report Catalyst for Change: A Roadmap to a Stronger Charitable Sector is: “That the Government of Canada, in consultation with the charitable and non-profit sector, reinstate the Human Resources Council for the Voluntary Sector, or a similar body by which the sector can collaborate with government to fulfill aspects of the human resources renewal plan.” It is vital for all stakeholders – governments who are major funders of charities, charitable organizations, donors, sponsors, and employees.
Are negative public perceptions accurate? Highlights from Charity Village’s 2019 Canadian Nonprofit Sector Salary & Benefits Report, shed light on compensation realities:
- Cash compensation continues to grow slowly for many. From 2011 to 2018, compensation grew at an average rate of 0.4% to 1.8% per year, depending on the level. For many that growth was too slow and in fact stagnant for many.
- Sector focus impacts average compensation. Compensation is organizationally dependent with arts based organizations having dramatically different frameworks than health related organizations. While health based charities are among the leaders in cash compensation, this is most likely due to the high concentration of highly paid professionals in institutions such as hospitals and research.
- Larger charities generally offer larger salaries. Geography matters. Charities located in the larger metropolitan centres pay higher salaries especially at the most senior levels.
- Benefits continue to be an important part of the compensation package. While health benefits are an important perk, the more dominant one is retirement benefits, again especially important at the most senior levels.
- Education is highly valued by organizations and employees. This is a highly educated work force.
- Pay gap remains significant but is slowly shrinking. The gender related pay gap is most notable in larger organizations in the larger cities. Men tend to be more concentrated in higher paid jobs in larger cities with women having the same roles at lower pay in smaller organizations and smaller cities.
Patient-focused charities employ 7435 full-time staff serving patients and families across the country.
Charities differ markedly in how many staff they employ, if any. While a few have many employees and are headed by an individual who is well-compensated, others have no full-time staff and are strictly run on a volunteer basis.
The review of human resources for patient-focused charities revealed
the following:
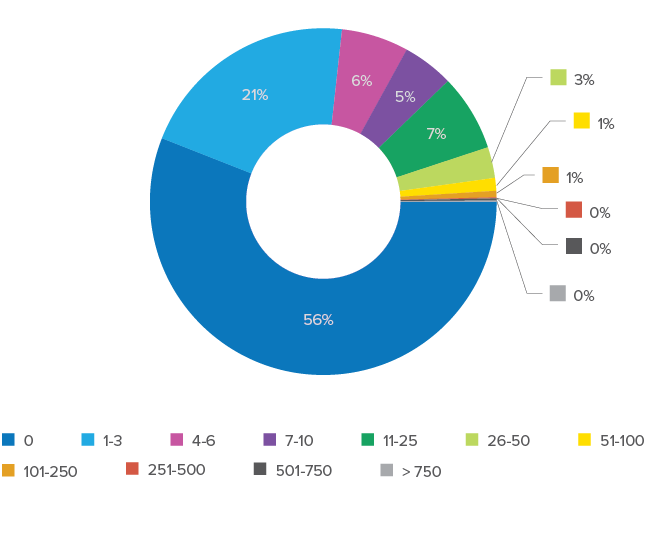
- 56% have NO full-time employees
- 22 organizations employ 56% of all employees
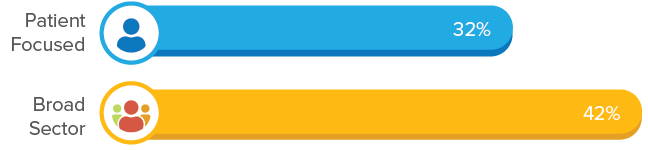
- Full-time compensation is 32% of total revenue
- 27 organizations reported 39 employees earning between $200,000 and $350,000
- 5 organizations reported one employee earning over $350,000
It may seem shocking to some that 56% of charities do not have any full-time employees but it is consistent with the 58% total seen across the broad sector of all charities.
56% of charities do not have any full-time employees.
Similarly, the segment comprising organizations with more than 50 full-time employees contains only 22 patient groups or 2.2% of the total of patient-focused groups which is comparable to the broad charitable sector with 2.8% of charities.
These 22 organizations employ 4182 full-time people which is 56% of all full-time employees for patient-focused charities.
Another interesting segment includes those with 11-50 employees. There are 2223 employees or 30% of the total work force of 7435, spread among 101 groups or 10% of total groups, which is higher than the broad sector at 7%.
Table 16: Organizations segmented by number of employees
| Number of Employees | # of Groups | % of Total Groups | # of Full-time Employees |
|---|---|---|---|
| 0 | 563 | 56.08% | 0 |
| 1-3 | 209 | 20.82% | 337 |
| 4-6 | 63 | 6.27% | 306 |
| 7-10 | 48 | 4.78% | 387 |
| 11-25 | 72 | 7.17% | 1188 |
| 26-50 | 29 | 2.89% | 1035 |
| 51-100 | 12 | 1.20% | 822 |
| 101-250 | 6 | 0.60% | 943 |
| 251-500 | 1 | 0.10% | 315 |
| 501-750 | 2 | 0.20% | 1249 |
| > 750 | 1 | 0.10% | 853 |
| 1004 | 100% | 7435 |
Chart 18: Percentage of Organizations by number of employees
Total expenditure on all compensation
Looking at the entire patient-focused sector, expenditure for all compensation, full-time and part-time totals $525,130,656 which is 38.43% of total revenue. That compares against the broad sector with 53% of total revenue. Are these patient-focused groups offering lower wages or running leaner? The data from the Charity Village report indicates that health related charities are supposed to have higher wages. Perhaps greater investigation is necessary to get a clearer idea whether patient-focused groups are disadvantaged in comparison to the rest of the health charity sector.
Total expenditure on full-time compensation
| Total Compensation Expenditures | $525,130,656 | 38.43% |
| Total Part-time Expenditures | $86,947,977 | 6.36% |
| Full-time Expenditures | $438,182,679 | 32.07% |
The CRA does not break out full-time compensation from total compensation, but only breaks out part-time compensation. By deducting part-time compensation from the total we see that full-time compensation is 83.4% of all compensation and 32% of total revenue. By comparison the broad sector full-time compensation is 42% of total revenue.
Chart 19: Percentage of expenditure on full-time compensation
This may be significant because part-time staff numbers are more likely to fluctuate according to a number of factors including economic trends and program load while the full-time numbers may remain stable over a longer period of time. An erosion or explosion of these full-time numbers can be an indicator of financial strength or weakness. The top 15 compensation budgets are listed in Table 17.
Table 17: Top 15 compensation budgets.
| Organization | Total Compensation | # Full-time Employees | Total Revenue |
|---|---|---|---|
| Canadian Cancer Society | $64,456,759 | 651 | 187,804,352 |
| Heart And Stroke Foundation of Canada | $50,752,097 | 598 | 169,462,000 |
| The Canadian National Institute for the Blind | $32,786,582 | 853 | 92,399,362 |
| Canadian Diabetes Association | $17,496,170 | 234 | 36,351,844 |
| Multiple Sclerosis Society of Canada | $15,634,229 | 315 | 47,688,360 |
| British Columbia Transplant Society Branch | $14,088,112 | 35 | 64,136,393 |
| The Arthritis Society | $13,694,304 | 131 | 26,459,140 |
| Head Injury Rehabilitation Ontario | $12,097,200 | 165 | 14,994,149 |
| Deafblind And Sensory Support Network of Canada | $11,243,859 | 172 | 15,036,388 |
| The Kidney Foundation of Canada | $9,046,583 | 136 | 27,996,642 |
| Juvenile Diabetes Research Foundation Canada | $7,959,982 | 105 | 20,823,730 |
| Spinal Cord Injury Ontario | $7,636,529 | 86 | 10,292,881 |
| Cerebral Palsy Parent Council of Toronto | $7,202,939 | 80 | 8,862,710 |
| Cystic Fibrosis Canada | $6,397,230 | 80 | 18,881,000 |
| Alzheimer Society of B.C. | $5,768,743 | 72 | 9,728,822 |
The ten (10) highest compensated, permanent, full-time positions
There is no Sunshine List for the charitable sector comparable to lists for government and public sector employees which publicly disclose salary, benefit and severance information for all employees earning over $100,000 annually. Such lists are intended to shed light on government spending and provide accountability and transparency.
For donors and sponsors concerned about potentially bloated payrolls, charities that are agents of the government, such as hospitals or universities, do disclose their salary information on the provincial Sunshine List, if the province publishes one. For all charities, the CRA requires disclosure of the ten highest compensated, permanent, full-time positions. Note the limit of 10 which, while intriguing, does not complete the full salary picture if an organization employs more than 10 people.
The broad sector data implies that the patient group is bottom heavy in the lower wage brackets.
Among the patient-focused groups, these shortcomings become readily apparent. The limit of the CRA disclosure restricts the data to only 32% of the full-time workforce. The largest segments are those earning between $40,000 and $79,999 with 15.47% of the total and those earning less than $40,000 representing over 9% of all employees. To provide some comparative data, we captured the similar percentages from the broad sector. Taken at face value the broad sector data implies that the patient group sector is bottom heavy in the lower wage brackets but must be considered in light that the data only represents 11% of the broad sector work force vs 32% for the patient groups. If anything, this highlights the difficulty donors and sponsors have in getting useful data to inform their decisions when trying to isolate strategies to support charitable missions or organizational requirements. Nevertheless, for those for whom the issue of compensation is a critical component of decision making, these disclosure structures provide a method that can be applied to specific charitable organizations without restriction to the top 10 as prescribed by CRA.
Table 18: The ten (10) highest compensated, permanent, full-time positions by salary category.
| Full-time Employee Salary | # Groups | # Positions | % of Positions | Broad Sector % |
|---|---|---|---|---|
| $1 – $39,999 | 243 | 685 | 9.21% | 5.52% |
| $40,000 to $79,999 | 329 | 1150 | 15.47% | 3.73% |
| $80,000 to $119,999 | 152 | 336 | 4.52% | 1.02% |
| $120,000 to $159,999 | 65 | 123 | 1.65% | 0.32% |
| $160,000 – $199,999 | 28 | 49 | 0.66% | 0.14% |
| $200,000 – $249,999 | 13 | 19 | 0.26% | 0.09% |
| $250,000 – $299,999 | 11 | 14 | 0.19% | 0.05% |
| $300,000 – $349,999 | 3 | 6 | 0.08% | 0.04% |
| $350,000 and over | 5 | 5 | 0.07% | 0.05% |
| 849 | 2387 | 32.10% | 10.95% |
The Sunshine List
As stated earlier, the lack of sufficient data makes it difficult to fully assess the salary grades of employees in our patient-focused groups. To satisfy what seems to be a high level of curiosity among the general public and especially donors and sponsors, we have compiled our own sunshine list from publicly available data provided by CRA. We caution, of course, that the limitations of this data do not provide a fully accurate picture.
Table 19: The Sunshine List
| Salary Category | Organization | Total |
|---|---|---|
| > $350,000 | Canadian Cancer Society | 1 |
| Heart And Stroke Foundation Of Canada | 1 | |
| Ontario Lung Association | 1 | |
| Prostate Cancer Canada | 1 | |
| The Canadian National Institute For The Blind | 1 | |
| $300,000 to $350,000 | Juvenile Diabetes Research Foundation Canada | 1 |
| The Arthritis Society | 1 | |
| Heart And Stroke Foundation Of Canada | 4 | |
| $250,000 to $300,000 | Alzheimer Society Of Canada | 1 |
| Crohn’s And Colitis Canada | 1 | |
Cystic Fibrosis Canada | 1 | |
| Multiple Sclerosis Society Of Canada | 1 | |
| Ottawa Regional Cancer Foundation | 1 | |
| Praxis Spinal Cord Institute | 1 | |
| Starlight Children’s Foundation Canada | 1 | |
| The Canadian National Institute For The Blind | 1 | |
| Canadian Cancer Society | 2 | |
| Canadian Diabetes Association | 2 | |
| Heart And Stroke Foundation Of Canada | 2 | |
| $200,000 to $250,000 | Alzheimer Society Of Toronto | 1 |
| Amyotrophic Lateral Sclerosis Society Of Canada | 1 | |
| Association Du Diabete Du Quebec Inc | 1 | |
| Heart And Stroke Foundation Canadian Partnership For Stroke Recovery | 1 | |
| Parkinson Canada Inc. | 1 | |
| Pediatric Oncology Group Of Ontario | 1 | |
| Prostate Cancer Canada | 1 | |
| The Arthritis Society | 1 | |
| Canadian Cancer Society | 2 | |
| Multiple Sclerosis Society Of Canada | 2 | |
| The Canadian National Institute For The Blind | 2 | |
| The Kidney Foundation Of Canada | 2 | |
| Heart And Stroke Foundation Of Canada | 3 | |
| $160,000 to $200,000 | Alberta Lung Association | 1 |
| Alzheimer Society Of B.C. | 1 | |
| Association Du Diabete Du Quebec Inc | 1 | |
| British Columbia Lung Association | 1 | |
| British Columbia Transplant Society Branch | 1 | |
| Canadian Lung Association | 1 | |
| Childhood Cancer Canada Foundation | 1 | |
| Deafblind And Sensory Support Network Of Canada | 1 | |
| Fondation Quebecoise Du Cancer Inc. | 1 | |
| Huntington Society Of Canada | 1 | |
| Hypertension Canada | 1 | |
| Movember Canada | 1 | |
| Muscular Dystrophy Canada | 1 | |
| Osteoporosis Canada | 1 | |
| Ottawa Regional Cancer Foundation | 1 | |
| Ovarian Cancer Canada | 1 | |
| Pediatric Oncology Group Of Ontario | 1 | |
| Praxis Spinal Cord Institute | 1 | |
| Spinal Cord Injury Ontario | 1 | |
| The Foundation Fighting Blindness | 1 | |
| The Leukemia & Lymphoma Society Of Canada | 1 | |
| Cystic Fibrosis Canada | 3 | |
| Juvenile Diabetes Research Foundation Canada | 3 | |
| Multiple Sclerosis Society Of Canada | 3 | |
| The Canadian National Institute For The Blind | 4 | |
| Canadian Cancer Society | 5 | |
| Canadian Diabetes Association | 5 | |
| The Arthritis Society | 5 | |
| $120,000 to $160,000 | Advanced Coronary Treatment (ACT) Foundation Of Canada, Inc. | 1 |
| AIDS Commitee Of Toronto | 1 | |
| Alberta Lung Association | 1 | |
| Alzheimer Society Of B.C. | 1 | |
| Alzheimer Society Of Brant, Haldimand Norfolk, Hamilton Halton | 1 | |
| Alzheimer Society Of Calgary | 1 | |
| Alzheimer Society Of London And Middlesex | 1 | |
| Alzheimer Society Of Manitoba Inc. | 1 | |
| Alzheimer Society Of Saskatchewan Inc | 1 | |
| Alzheimer Society Of Toronto | 1 | |
| Amyotrophic Lateral Sclerosis Society Of BC | 1 | |
| Asthma Canada | 1 | |
| Autism Society Ontario | 1 | |
| Canadian Aids Society | 1 | |
| Canadian Cancer Survivor Network | 1 | |
| Canadian Liver Foundation | 1 | |
| Canadian Spinal Research Organization | 1 | |
| Canucks Autism Network Society | 1 | |
| Cardiac Health Foundation Of Canada | 1 | |
| Ch.I.L.D. Foundation | 1 | |
| Dystonia Medical Research Foundation Canada | 1 | |
| GI (Gastrointestinal) Society | 1 | |
| Head Injury Rehabilitation Ontario | 1 | |
| Hope Air | 1 | |
| Integrated Services For Autism And Neurodevelopmental Disorders | 1 | |
| Lung Cancer Canada | 1 | |
| Lymphoma Foundation Canada | 1 | |
| Mitocanada Foundation | 1 | |
| Ontario Society For Crippled Children | 1 | |
| Pancreatic Cancer Canada Foundation | 1 | |
| Parkinson Society British Columbia | 1 | |
| Prostate Cancer Canada | 1 | |
| Rethink Breast Cancer Canada | 1 | |
| Société Canadienne De La Sclérose En Plaques (Division Du Québec) | 1 | |
| Spinal Cord Injury Association Alberta | 1 | |
| Spinal Cord Injury Ontario | 1 | |
| The Association For The Rehabilitation Of The Brain Injured | 1 | |
| The Foundation Fighting Blindness | 1 | |
| The Lung Association Of Saskatchewan Inc. | 1 | |
| Transforming Faces | 1 | |
| Western Institute For The Deaf And Hard Of Hearing | 1 | |
| Alzheimer Society Of Alberta And Northwest Territories | 2 | |
| Heart And Stroke Foundation Of Ontario | 2 | |
| Muscular Dystrophy Canada | 2 | |
| Osteoporosis Canada | 2 | |
| Ovarian Cancer Canada | 2 | |
| The Arthritis Research Centre Society Of Canada | 2 | |
| The Canadian National Institute For The Blind | 2 | |
| Canadian Diabetes Association | 3 | |
| Crohn’s And Colitis Canada | 3 | |
| Heart And Stroke Foundation Canadian Partnership For Stroke Recovery | 3 | |
| Movember Canada | 3 | |
| Ontario Lung Association | 3 | |
| Parkinson Canada Inc. | 3 | |
| Pediatric Oncology Group Of Ontario | 3 | |
| Praxis Spinal Cord Institute | 3 | |
| The Arthritis Society | 3 | |
| Juvenile Diabetes Research Foundation Canada | 4 | |
| Multiple Sclerosis Society Of Canada | 4 | |
| Starlight Children’s Foundation Canada | 4 | |
| Amyotrophic Lateral Sclerosis Society Of Canada | 5 | |
| Cystic Fibrosis Canada | 5 | |
| The Kidney Foundation Of Canada | 5 | |
| The Leukemia & Lymphoma Society Of Canada | 5 | |
| British Columbia Transplant Society Branch | 9 |
Revenue per full-time employee
Revenue per Full-time Employee is an important ratio that measures approximately how much money each employee generates for a company. The revenue-per-employee ratio is most useful when comparing it against that of other companies in the same industry. It is a meaningful analytical tool because it measures how efficiently a particular firm utilizes its employees. Ideally, a company wants the highest ratio of revenue per employee possible because a higher ratio indicates greater productivity. Revenue per employee also suggests that a company is using its resources—in this case, its investment in human capital—wisely by developing workers who are very productive.
While it is understood that a charity is not a profit driven enterprise, the notion of efficient use of human resources is one that management of any type of enterprise pays attention to. It also allows donors and sponsors an opportunity to use a ratio they are familiar with in their own enterprise or as investors as they consider relationships with charities.
The ratio by itself is of little use without any frame of reference but to date that data has not been available. The intention of this ratio is to provide key evidence for those who dwell on the efficient utilization of the voluntary sector work force, providing meaningful evidence to establish a foundation for future analysis and assessment of work force efficiency.
Here are some examples of the revenue per employee ratio from some well-known brands:
| $1,928,831 | |
| $681,914 | |
| General Motors | $718,953 |
| Toyota Motor | $638,522 |
| Royal Bank of Canada | $782,635 |
| Bank of Montreal | $844,396 |
| Rogers Communications | $595,771 |
| Bell Canada | $459,962 |
| Home Depot | $265,155 |
| McDonalds | $102,812 |
| Starbucks | $76,594 |
Based on the available data, the revenue per full-time employee for patient groups and the broad sector has been computed as follows:
Chart 20: Revenue per full-time employee
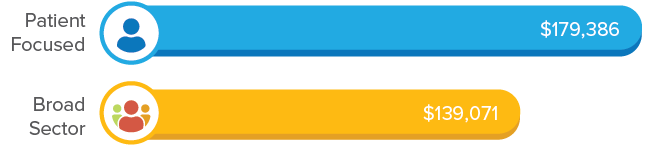
It may appear that the sector as a whole, and the patient-focused groups in particular, perform admirably against other labour intensive service sectors, however we did not include part-time workers in the analysis. This would require extensive study to be able to convert part-time data to the full-time equivalent, and in the absence of solid data that task is outside of the scope of this report. The presentation of this data is made on the expectation that those who are concerned deeply about measuring the efficiency of the charitable work force have an entry to a point of inquiry.
Table 20 illustrates the range of this ratio across charities from all of the revenue categories of charities earning over $100,000. It can be expected that the larger charities would have higher ratios but that is not necessarily the case. Examples like the National Indigenous Diabetes Association Inc. and Kidney Cancer Canada demonstrate that smaller organizations can operate efficiently in comparison to their much larger competitors. It speaks to their agility and resilience and may offer insight into their ability to withstand the pressures of economic and political crises.
Smaller organizations can operate efficiently in comparison to their much larger competitors.
This data does not necessarily set any bench marks for assessment, but rather is a starting point for anyone who needs to do a labour market analysis of the charitable sector, and in particular the patient-focused groups that exclusively support patients and their families.
Table 20: Examples of Revenue per Full-Time Employee from different revenue categories
| Organization | Total Revenue | # FT Employees | Rev / FTE |
|---|---|---|---|
| Canadian Cancer Society | 187,804,352 | 651 | $288,486 |
| Heart And Stroke Foundation of Canada | 169,462,000 | 598 | $283,381 |
| Crohn’s And Colitis Canada | $14,704,213 | 58 | $253,521 |
| Parkinson Canada Inc. | $10,400,951 | 72 | $144,458 |
| Osteoporosis Canada | $7,500,466 | 51 | $147,068 |
| Canadian Liver Foundation | $6,920,260 | 26 | $266,164 |
| Huntington Society of Canada | $4,286,307 | 18 | $238,128 |
| Alzheimer Society of York Region | $3,109,590 | 27 | $115,170 |
| The AIDS Committee of Ottawa | $1,136,214 | 14 | $81,158 |
| Young Adult Cancer Canada Inc. | $1,033,354 | 7 | $147,622 |
| Kidney Cancer Canada Association | $976,405 | 4 | $244,101 |
| Lung Cancer Canada | $764,683 | 5 | $152,937 |
| Scleroderma Society of Ontario | $312,047 | 5 | $62,409 |
| National Indigenous Diabetes Association Inc. | $268,825 | 1 | $268,825 |
| National Gaucher Foundation of Canada | $188,677 | 1 | $188,677 |
Total number of part-time employees
Only 400 (40%) patient groups reported employing 6,060 part-time employees. The ratio of part-time to full-time is 81.5% while the broad sector reports a ratio closer to 1:1. The top 15 employers of part-time employees are listed in Table 21. There are some new names that have not appeared on previous lists.
Table 21: Top 15 employers of part-time employees.
| Organization | # Part-time |
|---|---|
| Canucks Autism Network Society | 478 |
| The Canadian National Institute for the Blind | 331 |
| Canadian Diabetes Association | 306 |
| Deafblind And Sensory Support Network of Canada | 203 |
| Autism Services of Saskatoon Inc. | 196 |
| Ontario Society for Crippled Children | 193 |
| Canadian Cancer Society | 191 |
| Trillium Childhood Cancer Support Centre | 170 |
| Heart And Stroke Foundation of Canada | 162 |
| Autism Society Ontario | 155 |
| Head Injury Rehabilitation Ontario | 126 |
| Cerebral Palsy Parent Council of Toronto | 102 |
| Brain Injury Community Reentry(Niagara) Inc | 94 |
| The Kidney Foundation of Canada | 91 |
| Société Alzheimer Rive-Sud | 88 |
Total expenditure on compensation for
part-time employees
Patient-focused groups spent $86,947,977 on part-time compensation which was 6.36% of total revenue. The broad sector comparable figure is 10.4% possibly indicating much higher employment levels of part-time people or higher rates of pay. The fluctuating nature of this segment of the workforce due to seasonal and program load influences can also account for the variance.